Navigating Variance in Cross-Sport Accumulator Construction Through Community Data Patterns
Written by Carlo Albrecht · Aug 20, 2026

Navigating Variance in Cross-Sport Accumulator Construction Through Community Data Patterns
Cross-sport accumulators combine selections from different athletic disciplines into single wagers, yet variance rises sharply because each sport carries distinct statistical distributions, and bettors who construct these combinations must account for independent probabilities that rarely align in predictable ways. Community data platforms collect historical results, line movements and outcome frequencies from thousands of users, which allows patterns to emerge that individual analysis often misses, while August 2026 saw a notable spike in shared datasets during the transition between European football pre-seasons and North American basketball training camps.
Understanding Variance Across Multiple Sports
Variance measures the spread between expected returns and actual results in multi-leg bets, and when selections span soccer, basketball, tennis and other codes the dispersion widens because scoring rhythms, injury impacts and weather variables differ by sport. Researchers at academic institutions have documented how accumulator payouts grow exponentially with each added leg, yet the probability of all selections landing decreases at a similar rate, which creates a mathematical tension that community datasets help quantify through aggregated user histories rather than theoretical models alone.
Community Data as a Practical Tool
Online forums and dedicated analytics groups compile millions of past accumulator outcomes, and these records reveal recurring clusters such as lower variance in same-day events versus multi-day spans or reduced risk when mixing high-scoring leagues with lower-scoring ones. Data shows that users who filter selections by league-specific standard deviations achieve more consistent long-term results, while those who ignore these patterns experience wider swings, and this distinction becomes visible when large datasets are segmented by sport combination rather than treated as uniform pools.
Patterns Observed in August 2026
During August 2026, community contributors uploaded extensive records from the overlapping windows of major tennis hard-court swings, early European football fixtures and NBA summer league games, and the resulting datasets highlighted that variance dropped measurably when basketball overs were paired with soccer unders in specific time zones. Figures from these collections indicate that bettors who applied filters derived from peer-submitted results reduced their standard deviation by measurable margins compared with unfiltered approaches, although the absolute hit rate remained governed by the underlying probabilities of each sport.
Constructing Accumulators with Data Filters
Effective construction begins with identifying sports whose outcome distributions complement rather than compound volatility, and community platforms supply the granular breakdowns required to test such pairings at scale. One documented method involves ranking leagues by historical variance coefficients, then selecting combinations where the summed coefficients stay below a defined threshold, while another approach uses rolling windows of recent results to adjust for current form trends across borders. Both techniques rely on the volume of shared records that only emerge when many participants contribute anonymized slips and verified outcomes over extended periods.
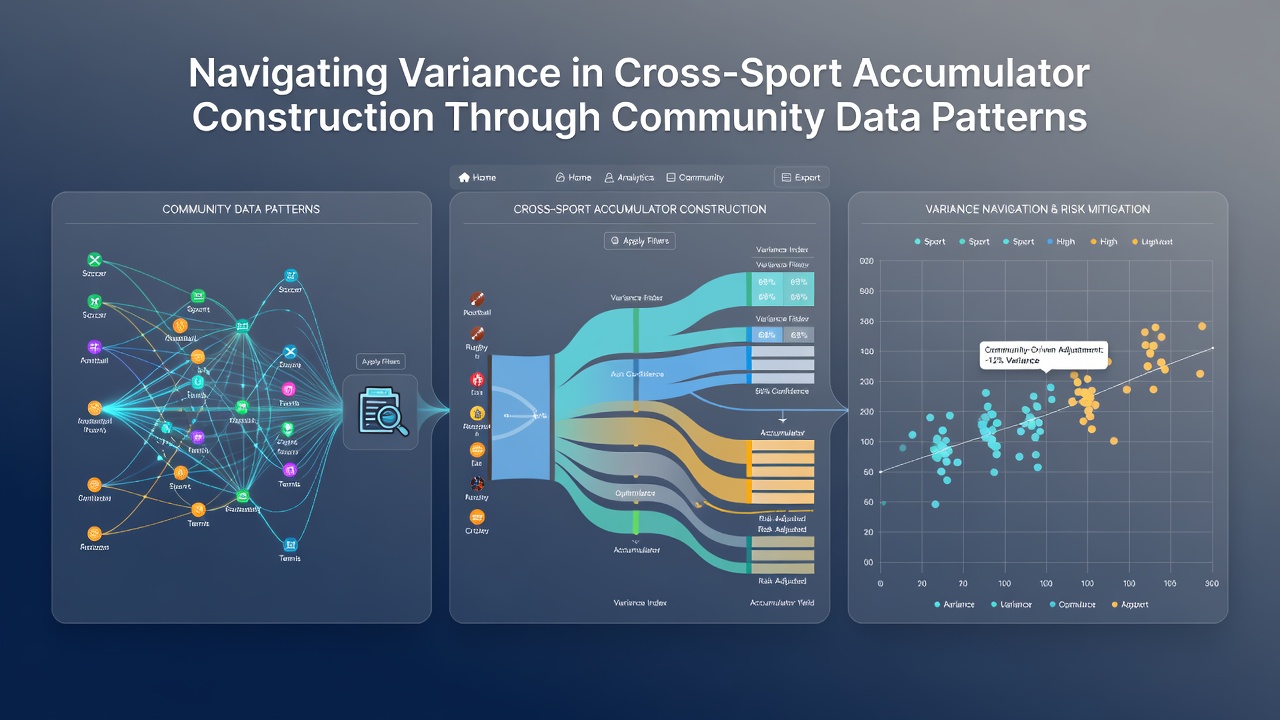
Turnout at major data-sharing events in August 2026 further accelerated the refinement of these filters, and participants noted that combining North American baseball totals with European basketball player props produced tighter result clusters than random pairings. The same datasets also flagged sports with mismatched scheduling densities as higher-variance territory, prompting users to apply stricter stake sizing rules when those combinations appeared unavoidable.
External Data Sources and Validation
Validation against independent records strengthens the reliability of community patterns, and NCAA statistics provide one benchmark for basketball-related selections while parallel academic studies from Australian research centers supply comparable baselines for rugby league and cricket. Cross-referencing these sources with aggregated user data reveals where crowd-sourced insights align with official distributions and where they diverge due to selection bias or regional betting market differences.
Conclusion
Community data patterns supply a practical layer for managing variance in cross-sport accumulators by surfacing empirical frequencies that theoretical models overlook, and continued growth in shared records during periods such as August 2026 demonstrates how collective input refines construction techniques over time. Those who integrate these patterns with established statistical references achieve more stable outcome distributions without altering the fundamental probabilities that govern any individual selection.