Tracing Momentum Decay Rates in Back-to-Back Fixtures Across Global League Calendars and Individual Athletic Circuits
Written by Morgan Richter · Aug 31, 2026
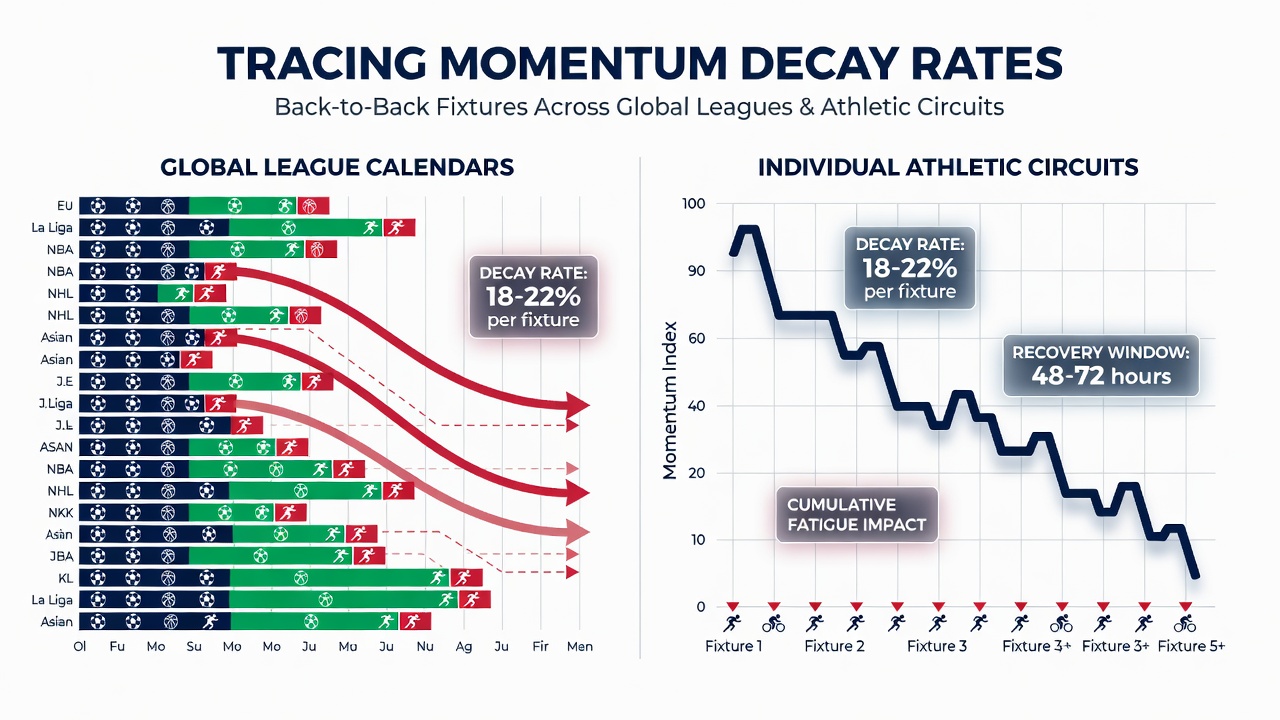
Tracing Momentum Decay Rates in Back-to-Back Fixtures Across Global League Calendars and Individual Athletic Circuits
Researchers track momentum decay rates by measuring how output metrics shift when teams and individuals face fixtures on consecutive days or within tight recovery windows, and data from multiple leagues shows consistent patterns across soccer, basketball, tennis, and track circuits. Performance indicators such as sprint distance, shot accuracy, and reaction time drop at measurable intervals, while recovery protocols attempt to slow those declines through targeted nutrition and sleep interventions.
Global League Calendars and Fixture Density
European soccer schedules pack matches into short windows during the winter months, yet similar compression appears in North American basketball where teams play four games in five nights on several occasions each season. Australian rules football calendars add long-haul travel between states, and observers note that decay rates accelerate when time-zone changes exceed three hours. Studies compiled by the Australian Institute of Sport document average reductions in high-intensity running of 6 to 9 percent in the second match of back-to-back sets, with the largest drops occurring in the final 15 minutes of play.
Individual athletic circuits present different variables because athletes manage their own travel and preparation. Tennis players on the ATP and WTA tours often compete on successive days during early tournament rounds, and heart-rate recovery data collected at the Australian Open and US Open reveal elevated resting rates that persist into the third set. Track and field athletes at Diamond League meets sometimes face heats and finals within 24 hours, and timing-system records indicate stride-length reductions that correlate with prior-day workload.
Measurement Methods Across Sports
Teams and governing bodies rely on wearable sensors, GPS units, and video-analysis software to quantify decay. In the NBA, load-management dashboards combine player-tracking data with subjective wellness scores, and figures released by league medical staff show that second-night performance in back-to-backs declines most sharply in three-point shooting percentage and defensive close-out speed. Soccer analysts in the Bundesliga and Serie A use similar GPS metrics but add neuromuscular testing before kickoff, and results published in sports-medicine journals indicate that countermovement-jump height falls an average of 4.2 centimeters after a midweek fixture followed by a weekend match.
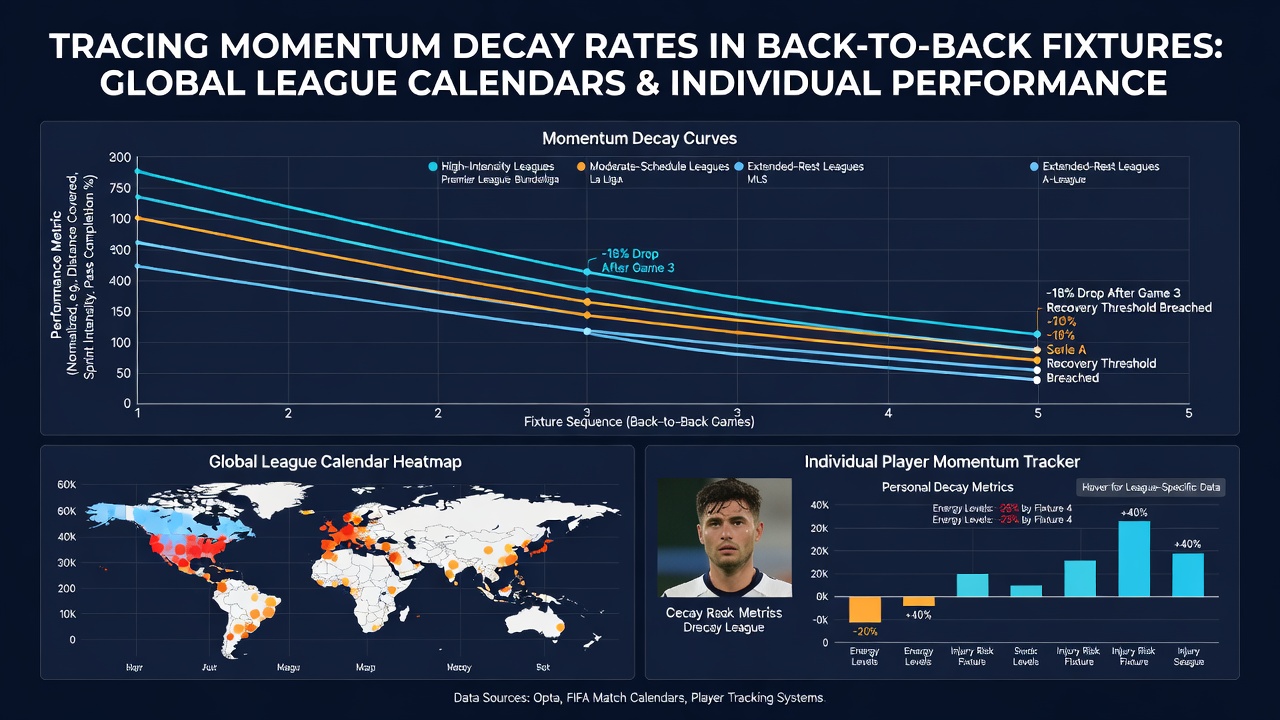
Researchers at the University of Michigan’s School of Kinesiology examined decay curves in collegiate basketball and found that teams traveling more than 500 miles between games experience an additional 3 percent drop in effective field-goal percentage compared with teams that remain in the same time zone. Their 2025 report, available through the university’s open-access repository, compares decay slopes across conference play and non-conference schedules and notes that the steepest declines cluster around the 36-hour recovery mark.
Recovery Windows and Calendar Adjustments
League organizers have tested schedule tweaks to lengthen minimum rest periods. Major League Soccer introduced a mandatory 72-hour gap between matches in 2024, and early-season data through August 2026 shows a modest flattening of second-match decay curves in total distance covered. The International Tennis Federation adjusted junior circuit calendars in 2025 to cap consecutive match days at three for players under 18, citing internal recovery studies that linked four-day sequences to elevated injury reports.
Individual athletes in endurance circuits apply periodized training blocks that deliberately insert low-load days before dense competition stretches. Marathon runners preparing for the World Athletics Championships often reduce weekly mileage by 20 percent in the 10 days leading into back-to-back tune-up races, and physiological monitoring at training centers in Kenya and Ethiopia indicates faster return of baseline heart-rate variability when those reductions occur.
Regional Variations in Data Collection
North American leagues emphasize real-time dashboards shared with coaching staffs, whereas European soccer clubs integrate laboratory blood-marker testing during congested periods. Canadian researchers at the University of Toronto published a 2026 analysis of ice-hockey back-to-backs that linked elevated creatine-kinase levels with reduced power-play conversion rates in the second game. Their dataset covers three NHL seasons and highlights that players aged 30 and older show decay rates 1.8 times steeper than those under 25 when rest falls below 48 hours.
Asian professional baseball leagues, including Nippon Professional Baseball, schedule doubleheaders during summer months, and pitch-tracking systems record velocity drops of 1.5 to 2 miles per hour for starters pitching on consecutive days. Analysts compare these figures with minor-league samples to isolate the effects of heat and humidity on decay acceleration.
Conclusion
Comprehensive tracking of momentum decay across calendars reveals sport-specific thresholds where performance metrics shift measurably after repeated fixtures. Data from multiple continents and governing bodies continues to inform schedule construction, recovery protocols, and athlete-management strategies that aim to keep output curves as flat as possible within the constraints of global competition demands.